Investment update to 28 February 2025
8 April 2025
In February 2025, financial markets faced rising uncertainty as investors reacted to potential shifts in US economic policy.
Despite short-term volatility, Brighter Super’s well-diversified portfolio remained resilient. Our disciplined investment strategy continued to deliver solid, competitive returns for members – reinforcing our commitment to long-term financial security and growth.
Super funds are designed for long-term growth. While short-term market ups and downs are natural, history shows that markets recover and grow over time. Staying calm and focusing on the long-term can help you stay on track through periods of volatility.
To learn more, read our latest article on what new tariffs mean for markets and your super.
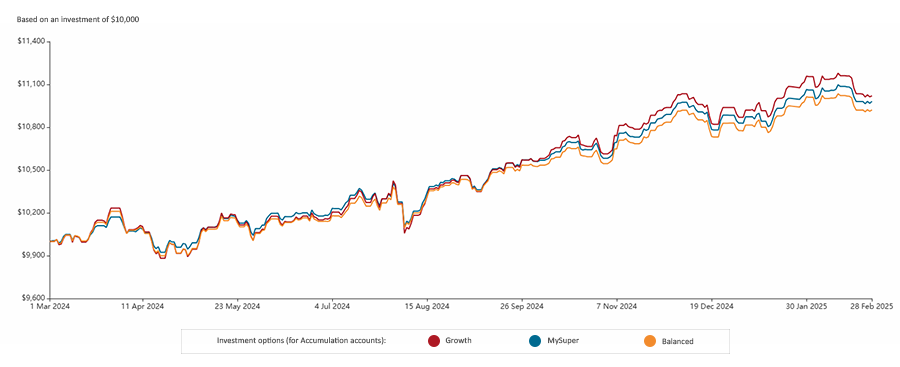
The graphs below highlight how we have delivered steady growth despite short-term fluctuations, based on an initial investment of $10,0001.
Graph 1: Performance of Growth, MySuper and Balanced options for Accumulation accounts over 1 year ended 28 February 2025
Graph 2: Performance of Growth, Balanced and Conservative Balanced options for Pension accounts over 1 year ended 28 February 2025
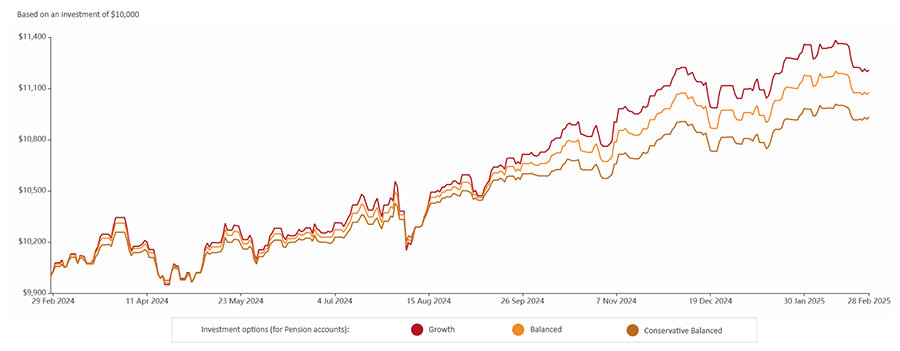
Over 1 year ended 28 February 2025, we navigated periods of volatility and achieved the following returns for these options:2
- Accumulation accounts: Growth (10.65%), MySuper (10.17%) and Balanced (9.61%).
- Pension accounts: Growth (11.71%), Balanced (10.44%) and Conservative Balanced (9.07%).
Explore how your investments are performing with our interactive performance graph, which lets you track all our investment options over your chosen period.
Summary of returns for diversified options
Below are the returns for Brighter Super’s diversified investment options for periods ended 28 February 20252.
| Investment option |
Returns for periods ended 28 February 20252 |
| 1 year |
3 years |
5 years |
7 years |
| Accumulation accounts |
| Growth |
10.65% |
9.09% |
9.82% |
9.83% |
| Balanced |
9.61% |
7.74% |
8.29% |
8.55% |
| MySuper |
10.17% |
7.65% |
6.91% |
6.95% |
| Indexed Balanced |
11.69% |
8.83% |
8.36% |
- |
| Conservative Balanced |
8.14% |
5.76% |
6.14% |
6.56% |
| Stable |
6.62% |
4.28% |
4.23% |
4.82% |
| Secure |
4.39% |
2.98% |
2.04% |
2.75% |
| Pension accounts |
| Growth |
11.71% |
10.29% |
10.99% |
11.03% |
| Balanced |
10.44% |
8.66% |
9.19% |
9.48% |
| Indexed Balanced |
12.75% |
9.66% |
9.30% |
- |
| Conservative Balanced |
9.07% |
6.59% |
6.82% |
7.34% |
| Stable |
7.47% |
4.92% |
4.78% |
5.47% |
| Secure |
4.98% |
3.21% |
2.02% |
2.91% |
High industry rankings
Brighter Super remains one of the top performers in the industry. According to the latest SuperRatings survey (February 2025), most of our diversified investment options delivered top quartile returns for 3, 5 and 7 years ended 28 February 20253.
Brighter Super’s Growth and Balanced options continued to rank highly in their respective SR50 Index (Accumulation) and SRP50 Index (Pension), which track the top 50 super funds in Australia by size.
| Option |
Ranking in respective SuperRatings SR50 and SRP50 index3 |
3 years ended
28 February 2025 |
5 years ended
28 February 2025 |
7 years ended
28 February 2025 |
| Growth (Accumulation) |
6th |
4th |
1st |
| Growth (Pension) |
1st |
1st |
1st |
| Balanced (Accumulation) |
5th |
5th |
1st |
| Balanced (Pension) |
4th |
3rd |
2nd |
Global market summary
Uncertainty surrounding new US economic policies weighed on global markets in February, leading to a decline in Developed Market shares. As a result, the MSCI World Index (hedged into AUD) posted a return of -0.9% for the month.
In the US, the S&P 500 returned -1.3% for February. In addition to trade policy uncertainty, some incoming US economic data was softer. Following the Federal Reserve’s decision to keep rates steady in January, policymakers indicated they wanted to see further progress on inflation before considering any further rate cuts. The US corporate earnings season proceeded positively, with earnings growth continuing to track in the low double digits.
In Asia, Chinese equities returned 11.6% in local currency. Market optimism was likely driven by a range of further stimulus measures announced by the Chinese government, including easier monetary policy and support for the property sector. Additionally, there was improved optimism around local advancements in Artificial Intelligence, along with some signalling from the Chinese government that it intended to be more ‘business friendly’.
European shares outperformed the US market in February, with the MSCI Europe Index (in Euros) returning 3.5%. Relative performance over the previous three months was also particularly strong, with broad-based gains across major European geographies. Defence stocks were one of the key drivers for European outperformance, driven by expectations that European governments would begin investing more heavily in defence spending.
In Australia, share markets were lower, with the ASX300 returning -3.8%. Information Technology was particularly impacted, with the sector returning -12.3%. Financials and Materials (the two largest sectors) were also lower, by –4.4% and -2.9% respectively. In February 2025, the Reserve Bank of Australia (RBA) cut the cash rate for the first time since 2020, following the release of Consumer Price Index suggested inflation was gradually returning to target. The RBA stated it would take a cautious approach to further rate cuts.
Australian and Overseas bonds were both stronger, returning 0.9% and 1.2% respectively. Markets were likely responding to the marginal increase in uncertainty surrounding the economic outlook. The Australian 10-year government bond yield fell 0.13% to 4.30%, whilst the US 10 year yield fell more materially, by 0.35% to 4.19%.
The Australian dollar was weaker against the currencies of most major trading partners over February. Movements were most pronounced relative to the Japanese yen (-3%), whilst performance relative to the US dollar was more muted, returning -0.3%.
- The values provided in the graphs represent past performance only. Past performance is not a reliable indicator of future performance. Investment returns are not guaranteed. Investment returns are net of investment fees, transaction costs and taxes (where applicable) and gross of administration fees. The figures shown in the graph are based on an initial investment of $10,000 at the start date of your chosen investment period, or at the option's commencement date if it launched after the start date of your investment period. The values shown in the graph are based on unit prices which have been derived from each option's interim daily unit prices. The values of investment do not take into account any withdrawals or contributions.
Changes to fees, asset allocations, return targets and risk levels all play a significant role in the performance of each investment option. These factors are subject to change in the future. Each of our investment options has a different return target and risk level. When deciding how to invest your money consider your overall investment objectives, tolerance for risk and timeframe for investing.
- SuperRatings Fund Crediting Rate Survey, February 2025. Refer to superratings.com.au for further information about these results. The information is current as at the date of the SuperRatings Survey (released on 19 March 2025). Investment returns are only one factor to be considered when deciding whether to invest. Past performance is not a reliable indicator of future performance.
Returns are based on daily unit pricing valuations and are net of external investment manager fees, net of taxes and gross of all Brighter Super administration fees for all performance periods.
- SuperRatings Fund Crediting Rate Survey, February 2025. Brighter Super’s options mentioned in this article are ranked in the following SuperRatings index: the Growth option is ranked in the SR50 Growth (77-90) Index for Accumulation accounts and the SRP50 Growth (77-90) Index for Pension accounts; the Balanced option is ranked in the SR50 Balanced (60-76) Index for Accumulation accounts and the SRP50 Balanced (60-76) Index for Pension accounts; the MySuper option is ranked in the SR50 MySuper Index.

