Investment update to 30 June 2026
4 August 2026
A decade of strong long-term returns for members
Brighter Super has continued to deliver strong long-term investment returns for members, with its diversified Growth and Balanced options recognised among Australia's top-performing super investment options.
Independent research from SuperRatings ranked Brighter Super's Growth and Balanced options among the top five performing options in their respective indices over both seven and ten years to 30 June 2026.¹ These strong results help members build their retirement savings over time and reflect Brighter Super's disciplined long-term investment approach.
Strong returns through changing markets
While Brighter Super delivered another year of solid investment performance in 2025/26, the longer-term results tell an even more important story.
Over the past decade, investors have experienced one of the most challenging periods in modern financial markets, including the COVID-19 pandemic, elevated inflation, rising interest rates, geopolitical conflict and ongoing market volatility. Despite these challenges, Brighter Super's diversified investment strategy has continued to deliver strong, consistent long-term returns for members.
Long-term investment performance plays an important role in helping members grow their super. While markets naturally move through periods of growth and volatility, staying focused on a long-term investment strategy has historically helped members grow their retirement savings.
Long-term performance at a glance
Strong long-term returns have helped Brighter Super's Growth and Balanced investment options earn recognition among Australia's top-performing super funds in the independent SuperRatings survey.¹
Below are the average annual returns and rankings for these investment options over seven and 10 years to 30 June 2026.
- Growth (Accumulation accounts): 9.60% over 7 years (2nd); 10.03% over 10 years (4th) – SR Growth (77-90) Index.
- Growth (Pension accounts): 10.72% over 7 years (1st); 11.22% over 10 years (2nd) – SRP Growth (77-90) Index.
- Balanced (Accumulation accounts): 8.24% over 7 years (3rd); 8.81% over 10 years (2nd) – SR Balanced (60-76) Index.
- Balanced (Pension accounts): 9.10% over 7 years (5th); 9.77% over 10 years (3rd) – SRP Balanced (60-76) Index.
Growing your super over the long term
Superannuation is one of the longest investments most Australians will ever make. Building your retirement savings isn't about responding to every market movement – it's about remaining focused on your long-term goals.
That's why Brighter Super takes a disciplined, diversified approach to investing. By investing across a broad range of asset classes and actively managing our portfolios, we aim to deliver competitive long-term returns while helping members navigate changing market conditions.
The past decade has demonstrated the value of this approach. Markets have experienced significant ups and downs. Despite these challenges, members who remained invested benefited from the long-term growth of financial markets.
Rather than reacting to short-term market movements, Brighter Super remains focused on delivering sustainable long-term returns that can help members achieve their retirement goals.
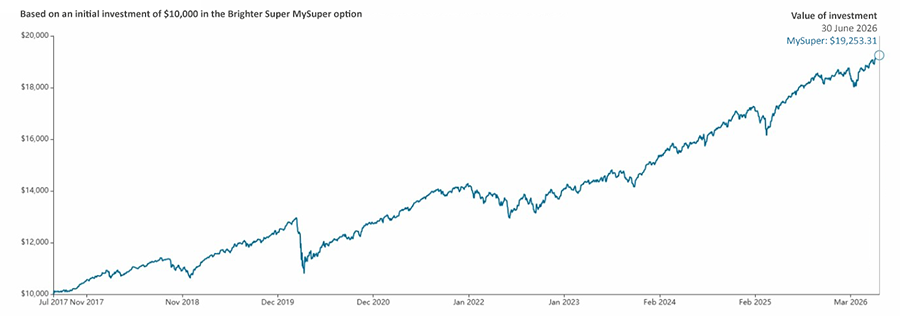
The chart below illustrates this in practice. Based on the interactive performance graph on our website, it shows how $10,000 invested in our MySuper option grew between 1 July 2017 and 30 June 2026, despite the market fluctuations during that period.
Latest returns
This table shows returns for our diversified investment options for periods ended 30 June 20261.
| Brighter Super investment option |
Returns for periods ended 30 June 2026 (%)1 |
| 1 year |
3 years |
5 years |
7 years |
10 years |
| Accumulation accounts |
| MySuper |
9.56% |
9.84% |
7.21% |
7.29% |
7.85% |
| Growth |
10.18% |
11.24% |
8.35% |
9.60% |
10.03% |
| Balanced |
8.60% |
9.90% |
7.03% |
8.24% |
8.81% |
| Conservative Balanced |
7.31% |
8.33% |
5.51% |
6.41% |
6.83% |
| Indexed Balanced |
8.16% |
10.78% |
7.52% |
8.05% |
n/a |
| Stable |
5.97% |
6.76% |
4.08% |
4.66% |
5.09% |
| Secure |
3.34% |
4.18% |
2.59% |
2.55% |
2.98% |
| Pension accounts |
| Growth |
11.25% |
12.50% |
9.31% |
10.72% |
11.22% |
| Balanced |
9.41% |
10.93% |
7.80% |
9.10% |
9.77% |
| Conservative Balanced |
8.10% |
9.32% |
6.12% |
7.12% |
7.59% |
| Indexed Balanced |
8.86% |
11.76% |
8.25% |
9.03% |
n/a |
| Stable |
6.69% |
7.64% |
4.64% |
5.25% |
5.77% |
| Secure |
4.05% |
4.83% |
2.91% |
2.73% |
3.26% |
Our monthly Investment Update focuses on the performance of our diversified options, where most of our members are invested.
Brighter Super offers a range of investment options to suit different goals, timeframes and risk levels. These include ready-made diversified options and single asset class options.
See the latest performance of our full set of investment options.
Looking back: global market trends in June 2026
Global developed shares were mostly steady in June, as gains across the broader market were offset by a shift away from the large technology companies that had driven recent gains. The MSCI World Index (AUD hedged) rose 0.1% for the month.
US shares fell slightly in June, with the S&P 500 down 1.0% for the month. Smaller companies performed better, reflecting a move toward cyclical and value-oriented sectors. Performance was mixed within the artificial intelligence (AI) sector, with semiconductor stocks continuing to benefit from strong demand, while the ‘Magnificent 7’ large technology companies experienced their largest monthly drop in more than a year.
US economic data continued to show a resilient economy, with 172,000 new jobs created in May, well above expectations. The unemployment rate was steady at 4.3%, even as inflation pressures remained elevated. The US Federal Reserve held its benchmark rate in the 3.5% to 3.75% range.
European shares outperformed broader developed markets in June, with the MSCI Europe Index (in Euros) up 3.0%. The European Central Bank raised rates by 0.25 percentage points in June, its first increase since 2023, citing persistent inflation pressures.
Emerging market shares posted a smaller gain following strong returns over the previous two months. The MSCI Emerging Markets Index (unhedged in AUD) rose 2.4% for the month. South Korean and Taiwanese shares, which make up more than half of the index, rose 3.1% and 3.0% respectively in local currency terms, driven by demand for semiconductors used in AI.
Australian shares rose 0.6% over the month, with larger companies outperforming smaller companies. Sector performance was mixed, led by Consumer Staples (+12.5%), Health Care (+12.5%) and Consumer Discretionary (+11.7%). Energy (-9.0%) and Materials (-6.8%) underperformed due to changes in commodity prices. The Reserve Bank of Australia held the cash rate steady at 4.35% in June
Government bond yields were mixed in June. US 10‑year Treasury yields were unchanged at 4.44%, and Global Fixed Interest returned 0.4% for the month. Australian 10‑year government bond yields fell 0.12 percentage points to 4.72%, and Australian Fixed Interest returned 1.0% over the month.
The Australian dollar fell 3.7% against the US dollar in June. The US dollar index (DXY) rose 2.3% by month-end, reflecting market expectations of a slower pace of interest rate cuts.
-
SuperRatings Fund Crediting Rate Survey, June 2026. Refer to superratings.com.au for further information about these results. The information is current as at the date of the SuperRatings Survey (released on 20 July 2026). Investment returns are only one factor to be considered when deciding whether to invest. Past performance is not a reliable indicator of future performance. Returns are based on daily unit pricing valuations and are net of external investment manager fees, net of taxes and gross of all Brighter Super administration fees for all performance periods.
Brighter Super’s Growth option is in the SR Growth (77-90) Index (for Accumulation accounts) and the SRP Growth (77-90) Index (for Pension accounts). Brighter Super’s Balanced option is in SR Balanced (60-76) Index (for Accumulation accounts) and the SRP Balanced (60-76) Index (for Pension accounts).
The information contained is up to date at the time of publishing. Some of the information may change following its release. Any questions can be referred to Brighter Super by calling 1800 444 396, or by emailing info@brightersuper.com.au.
Brighter Super Trustee (ABN 94 085 088 484) (AFSL 230511) (the Trustee) as trustee for Brighter Super (ABN 23 053 121 564) (RSE R1000160) (the Fund). Brighter Super may refer to the Trustee or the Fund as the context may be. Brighter Super products are issued by the Trustee on behalf of the Fund.
You should obtain and consider the Product Disclosure Statement (PDS) and Target Market Determination (TMD) before making any decision to acquire any products. A TMD is a document that outlines the target market a product has been designed for. Find the PDSs and TMDs at brightersuper.com.au/pds-and-guides
This article provides general advice only and does not take into account your individual objectives, financial situation or needs. As such, you should consider whether it is appropriate in light of your own objectives, financial situation and needs prior to making any decision. You should consult a licensed financial adviser if you require advice which takes into account your personal financial circumstances.