Investment update to 31 May 2025
24 June 2025
All diversified options have recovered from the market downturn
We’re pleased to report that all of Brighter Super’s diversified investment options – including our default MySuper option – have now fully recovered from the global market downturn that began in mid-February 2025.
The downturn was triggered by US trade tariff announcements, which shook investor confidence and led to sharp volatility across global share markets. Since then, markets have stabilised, and investor sentiment has improved significantly.
While markets have rebounded, ongoing tensions in the Middle East and renewed uncertainty around trade and other policies of the new US administration, may contribute to continued volatility over the coming months. This serves as a timely reminder that uncertainty and market fluctuations are a normal part of investing. Our guidance remains unchanged: keep calm and stay the course. This message holds true for all our members – whether you’re in Accumulation phase or drawing a Pension.
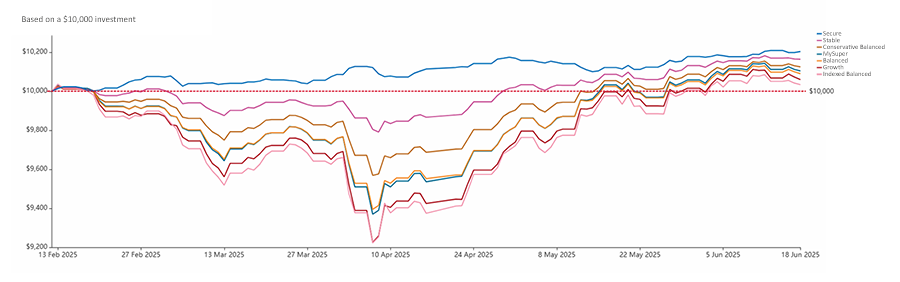
The graph below shows how Brighter Super’s diversified Accumulation options have rebounded, based on a $10,000 investment made on 12 February 20251.
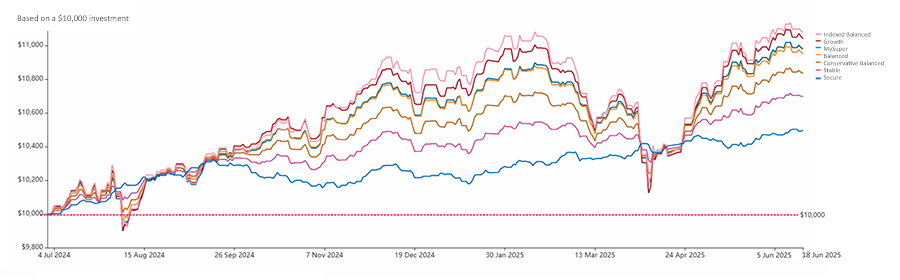
To provide a broader view, a second graph shows financial year-to-date performance, based on a $10,000 investment made on 1 July 20241.
Staying the course through volatility
Short-term fluctuations like the recent downturn reinforce the importance of staying invested and maintaining a long-term perspective. Our diversified options are designed to weather market volatility, with active management and broad asset diversification playing key roles in their strong recovery.
Events like these highlight our long-term investment approach – helping members remain focused on their retirement goals, even during uncertain times.
Performance of our diversified options
The table below shows returns for Brighter Super’s diversified investment options for periods ended 31 May 20252.
| Investment option |
Returns for periods ended 31 May 20251 |
| 1 year |
3 years |
5 years |
7 years |
| Accumulation accounts |
| Growth |
10.98% |
10.26% |
10.66% |
9.60% |
| Balanced |
10.02% |
8.95% |
8.97% |
8.35% |
| MySuper |
10.30% |
8.31% |
8.13% |
6.89% |
| Conservative Balanced |
8.72% |
7.11% |
6.69% |
6.45% |
| Indexed Balanced |
11.72% |
9.74% |
9.18% |
- |
| Stable |
7.23% |
5.57% |
4.62% |
4.76% |
| Secure |
5.07% |
3.75% |
2.51% |
2.75% |
| Pension accounts |
| Growth |
12.11% |
11.48% |
11.90% |
10.79% |
| Balanced |
10.91% |
9.98% |
9.94% |
9.28% |
| Conservative Balanced |
9.63% |
8.03% |
7.41% |
7.22% |
| Indexed Balanced |
13.06% |
10.96% |
10.30% |
- |
| Stable |
8.13% |
6.38% |
5.20% |
5.41% |
| Secure |
5.91% |
4.20% |
2.54% |
2.93% |
Strong rankings reflect resilient performance
Brighter Super’s Growth and Balanced options maintained high rankings in SuperRatings’ May 2025 Fund Crediting Rate Survey, which is used to benchmark top-performing options across the Australian superannuation industry2.
The two diversified options delivered top-quartile returns across 3, 5 and 7 years ended 31 May 2025. Their highest industry rankings were over 7 years ended 31 May 2025:
- Growth: ranked #1 highest-performing option in the SR50 Growth Index (Accumulation) and SRP Growth Index (Pension).
- Balanced: ranked #2 in the SR50 Balanced Index (Accumulation) and SRP Balanced Index (Pension).
Our MySuper option also performed strongly, ranking #6 in the SR50 MySuper Index over 3 years to 31 May 2025 – keeping its position in the industry’s top quartile.
Looking back: global market trends in May 2025
Share markets were generally positive in May 2025, as easing trade tensions between the US and major trading partners appeared to improve investor confidence. The MSCI World (hedged into AUD) performed strongly, returning 6% over the month. Major US technology companies outperformed broader share market indices.
In the US, the S&P500 returned 6.3% during May, while the tech-heavy Nasdaq 100 index rose more than 9%. US shares outperformed broader Developed Markets. Despite the previous quarter being dominated by news of trade tensions, the US corporate earnings season generally delivered robust results.
Chinese shares were stronger in May, although they underperformed broader share market indices. After agreeing to a 90-day pause on most tariffs, US and China trade delegates met in Geneva to continue trade negotiations. Expectations of progress in the talks helped support the market.
In Europe, the MSCI Europe Index (in EUR) returned 3.9%. Business activity indicators showed that the manufacturing sector continued to shrink in the Eurozone. However, the rate of decline eased over the first half of 2025.
Australian shares returned 4.2% in May, a performance in line with other Developed Markets. The Reserve Bank of Australia cut interest rates by 0.25% to 3.85%. It stated that while it does not expect Australia to fall into a recession, it remains wary of economic conditions deteriorating. The Albanese Labor government was re-elected in early May, securing the most seats in the party’s history.
Australian and global bond returns were mixed in May, returning 0.2% and -0.4% respectively. Bonds recovered from a mid-month dip, following the passage of the new US budget bill (which, at time of writing, has yet to pass the Senate). However, concerns grew that the bill could add to existing risks around the US fiscal deficit.
US 10 year yields ended May at 4.40%, while Australian 10 year yields finished the month higher at 4.26%.
Most major developed market currencies strengthened against the US dollar in May. US dollar weakness has been pronounced over the previous quarter, driven by concerns about fiscal stability and uncertainty over trade relations. The Australian dollar was also stronger against the US dollar, returning 0.6% over the month.
- The values provided in the graphs represent past performance only. Past performance is not a reliable indicator of future performance. Investment returns are not guaranteed. Investment returns are net of investment fees, transaction costs and taxes (where applicable) and gross of administration fees. The figures shown in the graph are based on an initial investment of $10,000 at the start date of your chosen investment period, or at the option's commencement date if it launched after the start date of your investment period. The values shown in the graph are based on unit prices which have been derived from each option's interim daily unit prices. The values of investment do not take into account any withdrawals or contributions.
Changes to fees, asset allocations, return targets and risk levels all play a significant role in the performance of each investment option. These factors are subject to change in the future. Each of our investment options has a different return target and risk level. When deciding how to invest your money consider your overall investment objectives, tolerance for risk and timeframe for investing.
-
SuperRatings Fund Crediting Rate Survey, May 2025. Refer to superratings.com.au for further information about these results. The information is current as at the date of the SuperRatings Survey (released on 20 June 2025). Investment returns are only one factor to be considered when deciding whether to invest. Past performance is not a reliable indicator of future performance.
Returns are based on daily unit pricing valuations and are net of external investment manager fees, net of taxes and gross of all Brighter Super administration fees for all performance periods.

